Exploratory Data Analysis and Regression on U.S. Violent Crime, Marriage, and Divorce
Introduction
We analyzed the relationship between violent crime and family structure indicators (marriage and divorce rates) across U.S. states from 2011–2024. Our data contains both rates per capita and actual counts for a variety of crime categories, as well as state-level marriage and divorce metrics.
The goals of this analysis were:
- Explore distributions and trends in crime and family rates.
Fit linear regressions to quantify associations.
1. Exploring Distributions and Trends in Crime and Family Rates.
Almost all of the violent crime rates were slightly right-skewed, where as divorce rates and marriage rates were more symmetrical. We considered log-tranformation for some of the violent crime rates such as homicide and rape rate, but decided against it.
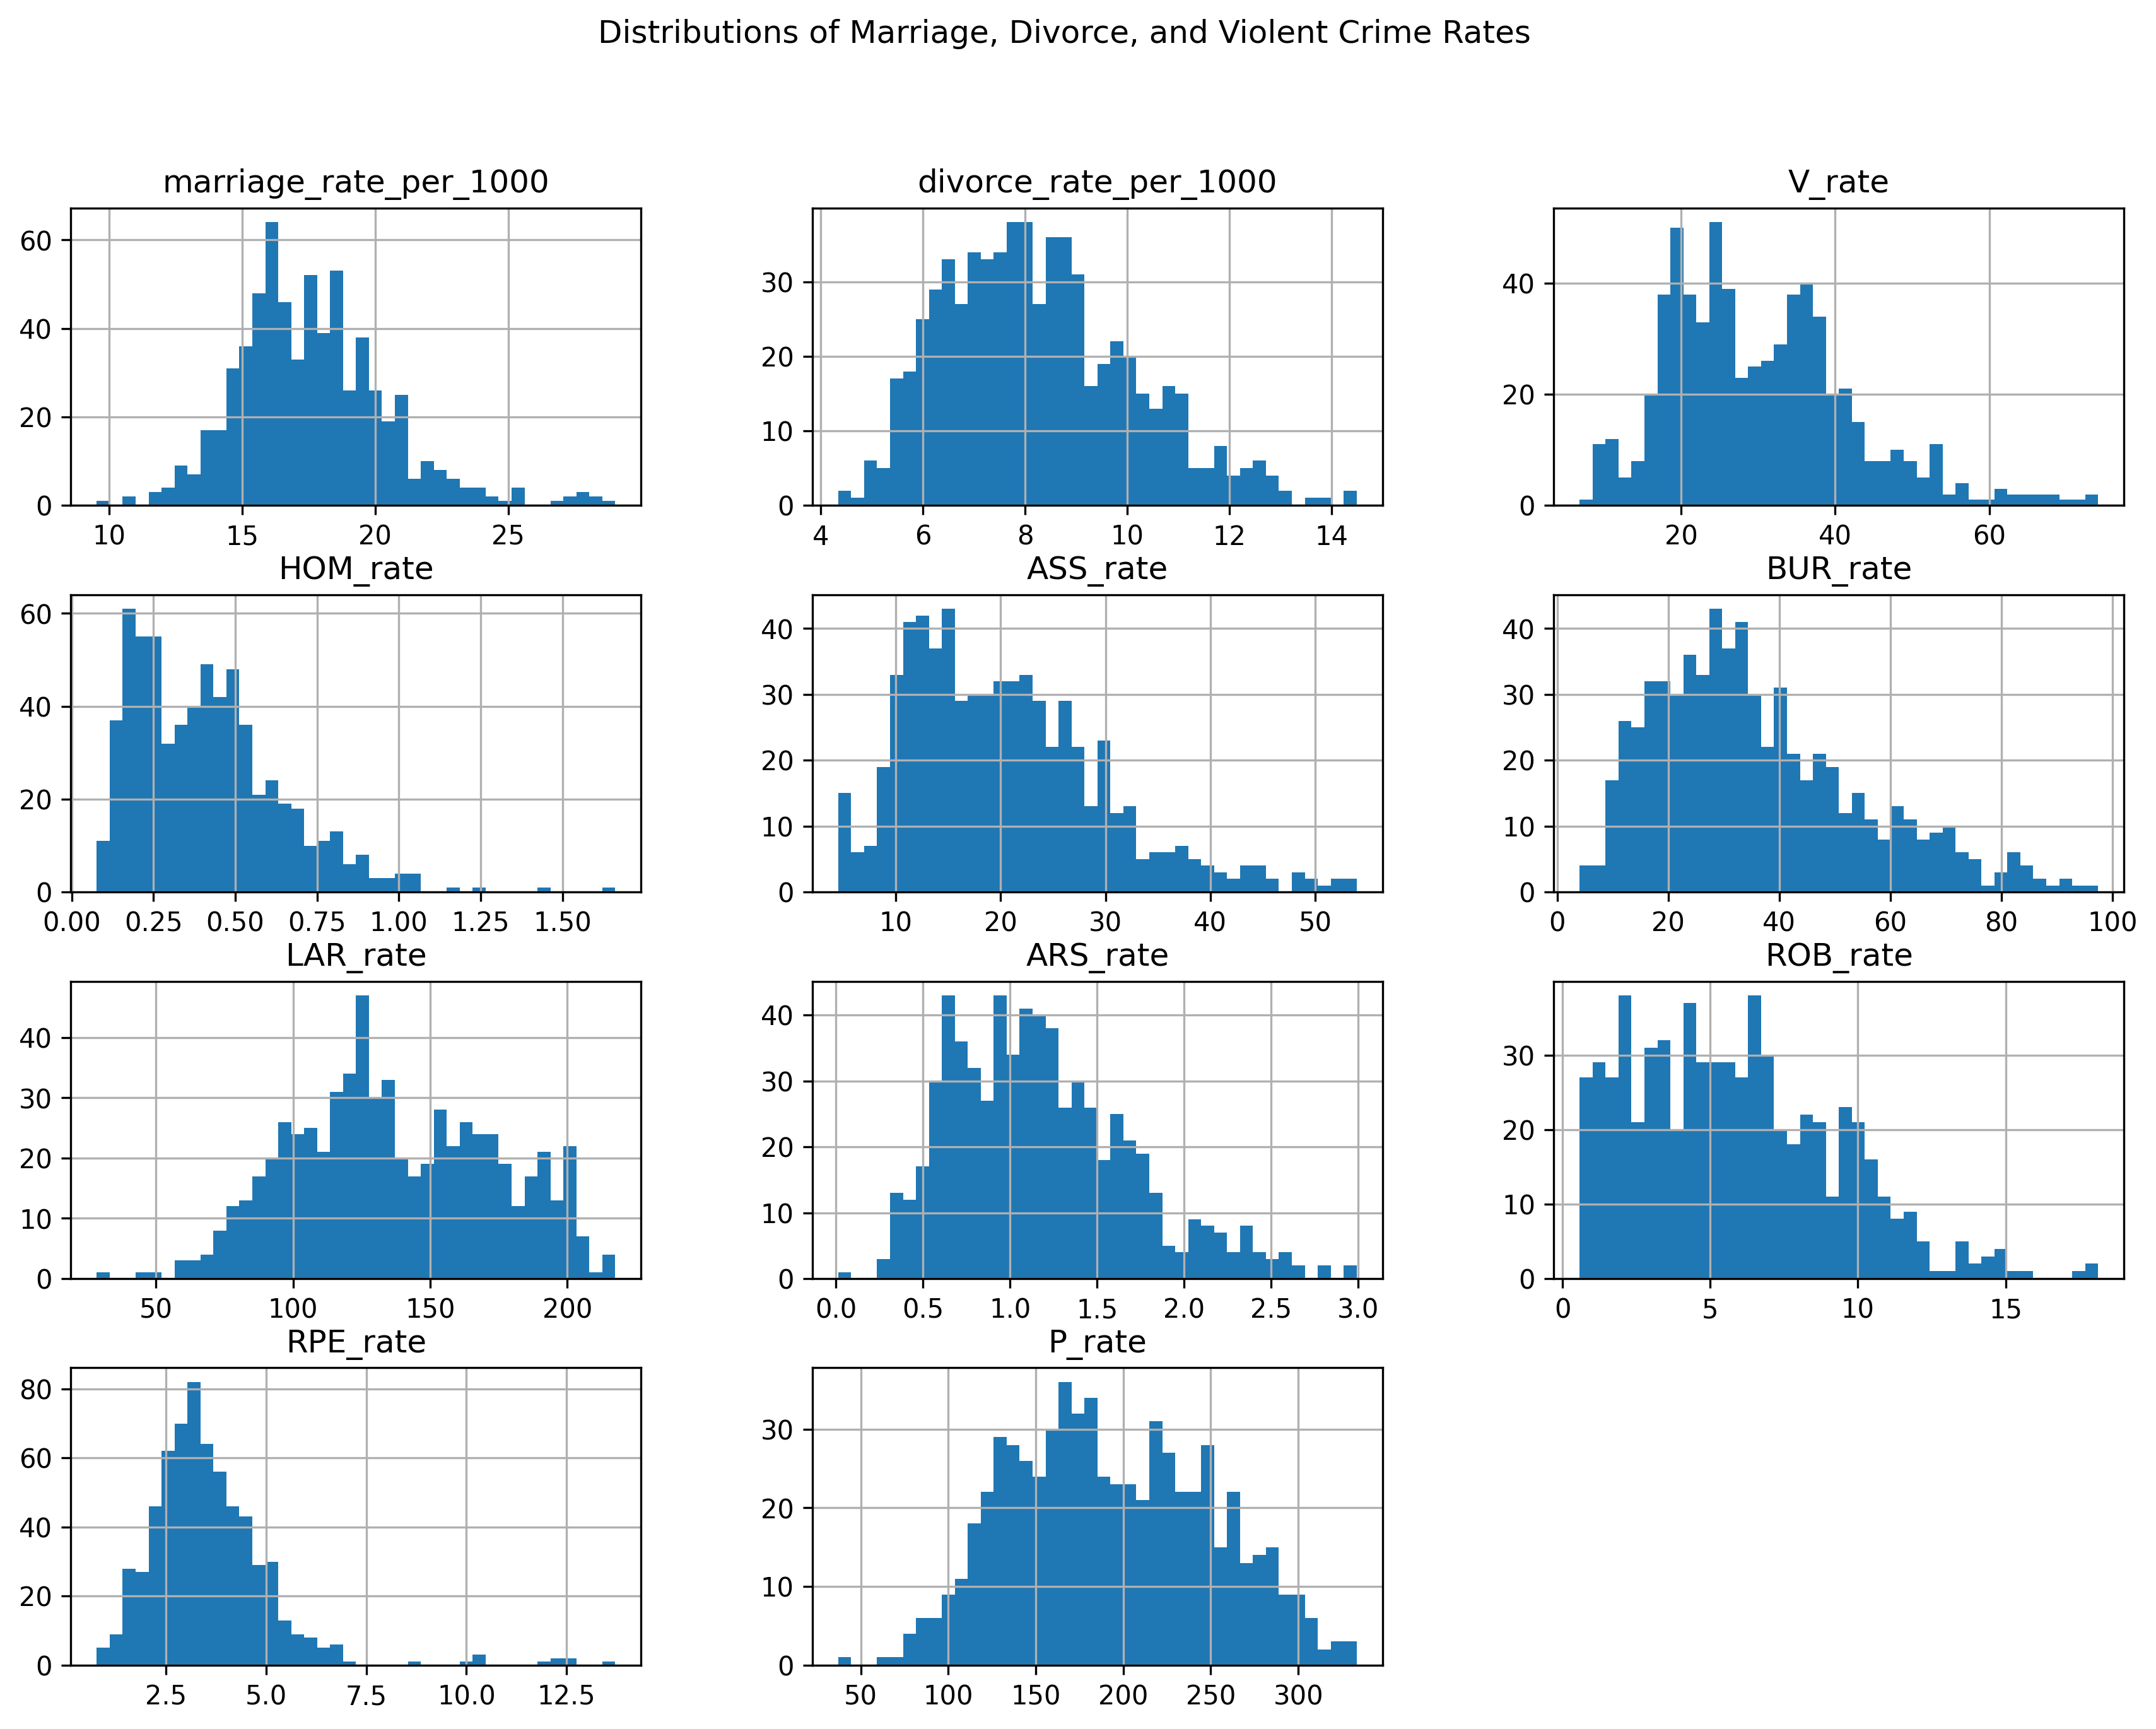
We’ve graphed each violent crime rate variable compared to marriage and divorce over time. Overall violent crime rate has stayed very stagnent, while both divorce and marriage rates per 1,000 people steadily dropped. While comparing the two we came across a couple of notable patterns where divorce/marriage and a crime rate behaved unexpectedly.
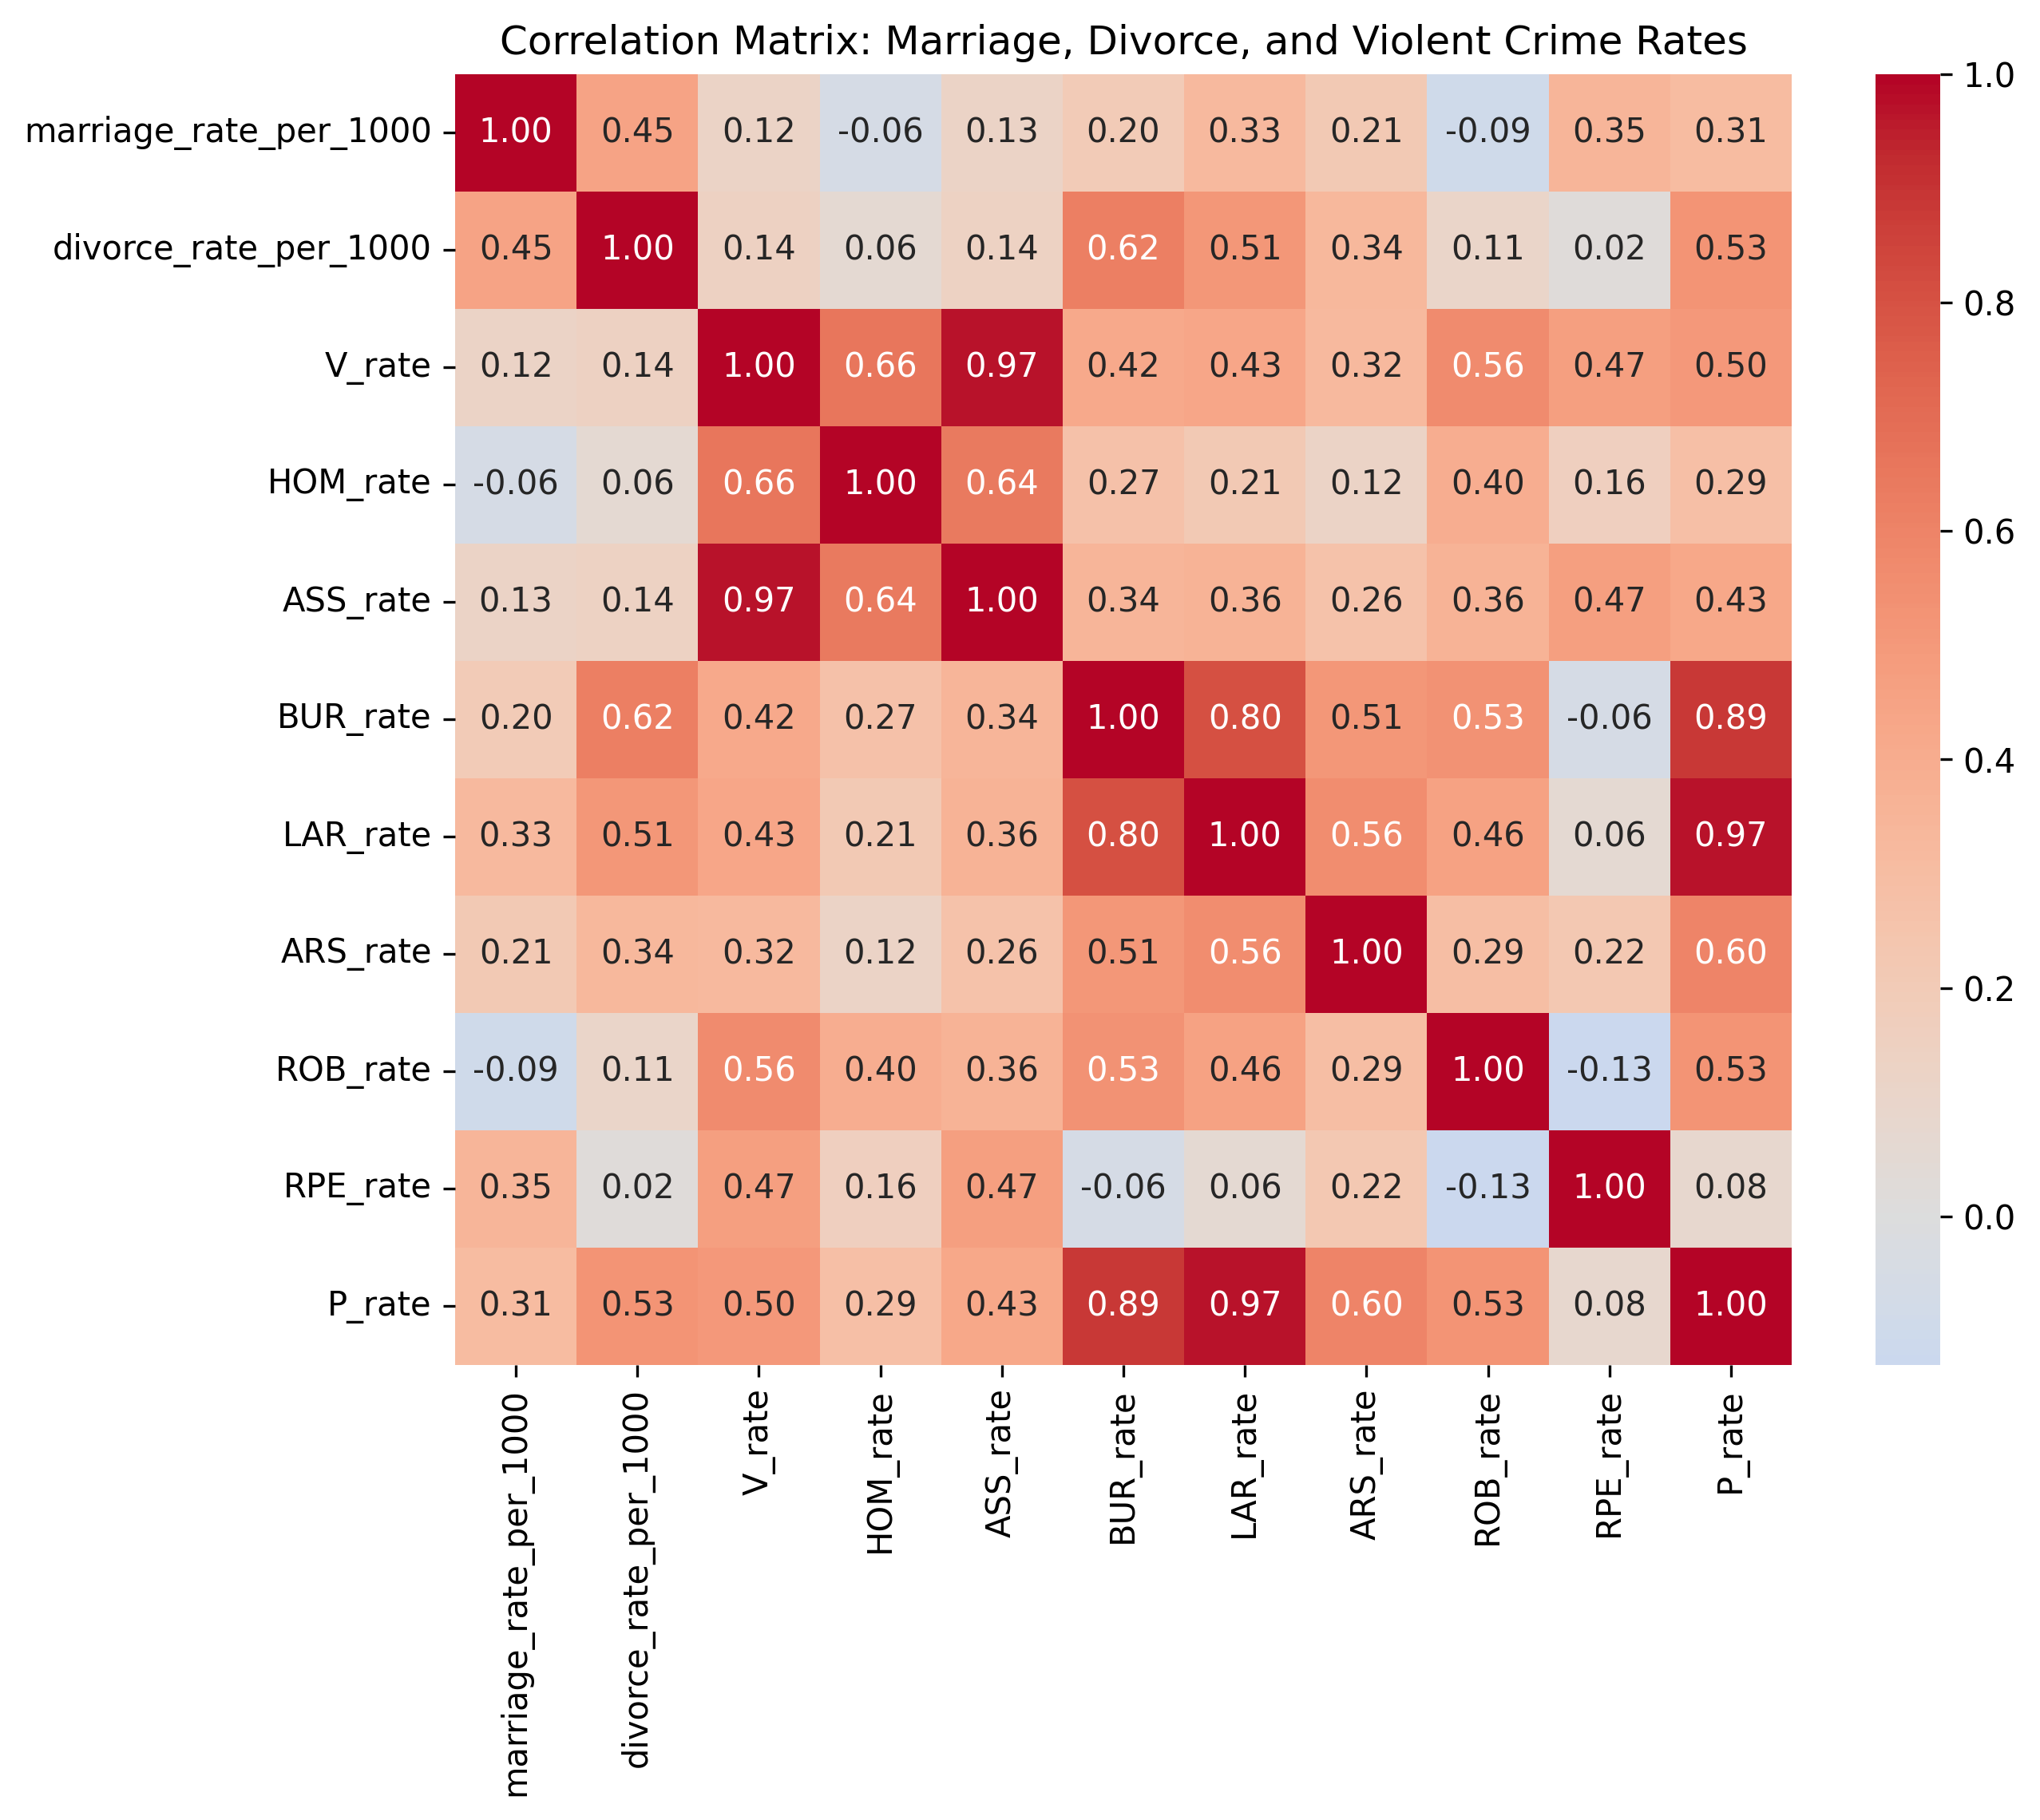
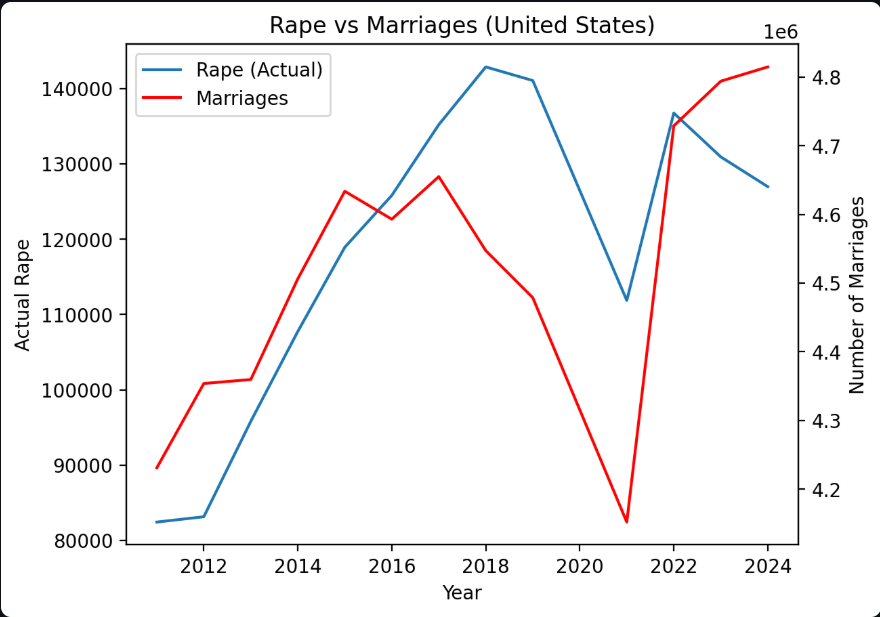
We saw an unexpectedly high correlation between marriage and rape, property crimes, and larsony (with rape having the highest correlation of 0.35).
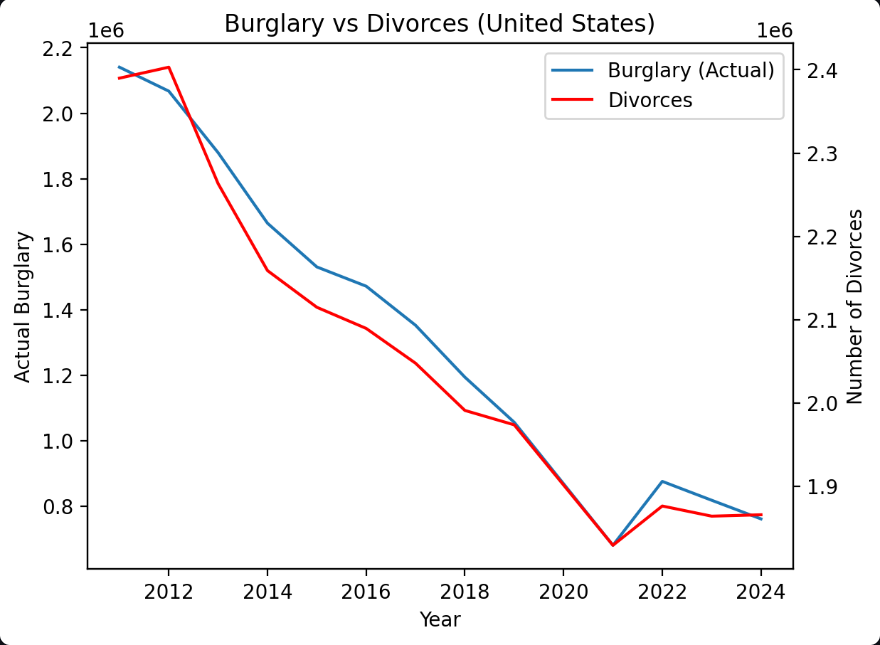
Additionally we saw that divorce rates have a much stronger correlation to violent crimes, especially with burglary rates, property crimes, and larsony (highest correlation with burglary 0.62)
2. Fit linear regressions to quantify associations.
To quantify the relationship between violent crime and family structure, we estimated a series of linear regression using state-year panel data. Two approaches were used.
2.1 Crime as the Outcome
We first modeled each violent crime rate as a function of marriage and divorce rates, controlling for state and year fixed effects:
\[ \text{CrimeRate}_{st} = \beta_1\text{MarriageRate}_{st} + \beta_2\text{DivorceRate}_{st} + \text{FixedEffect:State}_s + \text{FixedEffect:Year}_t + \epsilon_{st} \]
These regressions suggested that divorce rates are more strongly associated with violent crime rates than marriage rate. Additionally we very large coefficient of determinations from Burglary, Larsony, and Rape.
2.2 Marriage and Divorce as Outcomes
Second, we reversed the model, trating marriage and divorce rates as outcomes and using selected crime rate variables as predictors.
\[ \text{FamilyRate}_{st} = \sum(\beta_k\text{CrimeRate}_{kst}) + \text{FixedEffect:State}_s + \text{FixedEffect:Year}_t + \epsilon_{st} \]
For marriage rates, predictors included larceny and rape rates, because these were the two strongest predictors that weren’t higly correlated.
For divorce rates, predictors included burglary and arson rates, because these were the two strongest predictors that weren’t higly correlated.
Results indicate that divorce rates are more sensitive to violent crime rates than marriages. The inclusion of state and year fixed effects reduced coefficient magnitudes, showing that much of the raw correlation arises from persstent cross-state differences rather than shor-term fluctuations.
Conclusion and Next Steps
In this project, we examined the relationship between violent crime and family structure across U.S. states using both exploratory analysis and regression techniques. A couple key conclusions emerged.
First, national trends show declining marriage and divorce rates alongside relatively stable violent crime rates over data period. Second, linear regression results indicat that divorce rates are more strongly associated with violent crime rates than marriage rates, even after controlling for state and year fixed effects. However, much of the observed correlation is driven by persistent differences across states.
It’s important to note that these findings should be intepreted as associational not causal. As state-level data is too coarse to isolate links between crime and marriage dynamics, and unobserved factors such as economic conditions or policy differences may drive both.
Next Steps:
In the future our analysis would be greatly enhanced by having information for smaller regions, such as county or city level. State level is simply to large to draw any reasonable inference from. We were able to find a dataset which had marriage and divorce rates within the county level by year but we were unable to find anything close to the same for violent crime statistics. Another thing we can do to further our analysis is to have data for smaller time intervals. We would like to see if divorce rates and crime rates vary from month to month in a statistically significant way.
Links
~ * Streamlit Link * Github Project page * Documenatation on Github Page * FBI API documentation * Census API documentation * Census Bureau Data